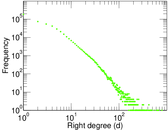
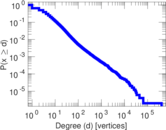
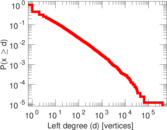
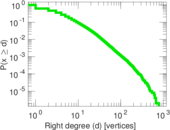
vi.sualize.us tag–item
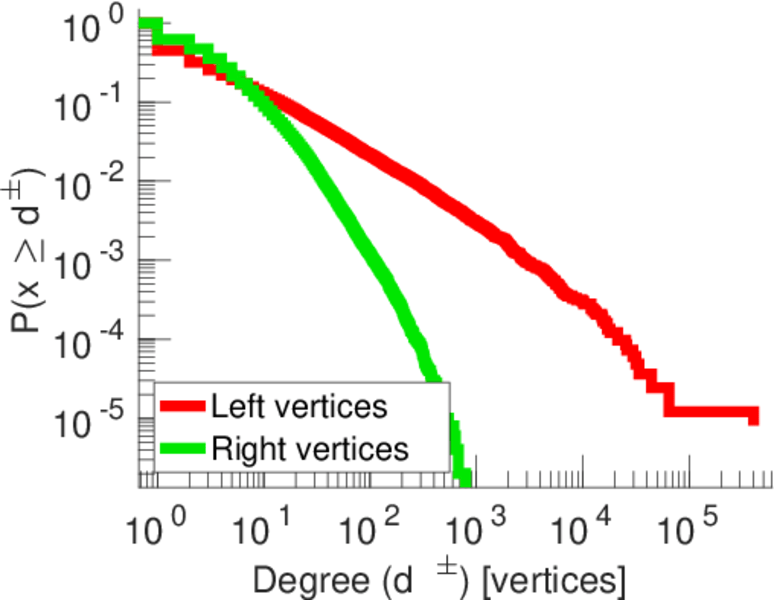
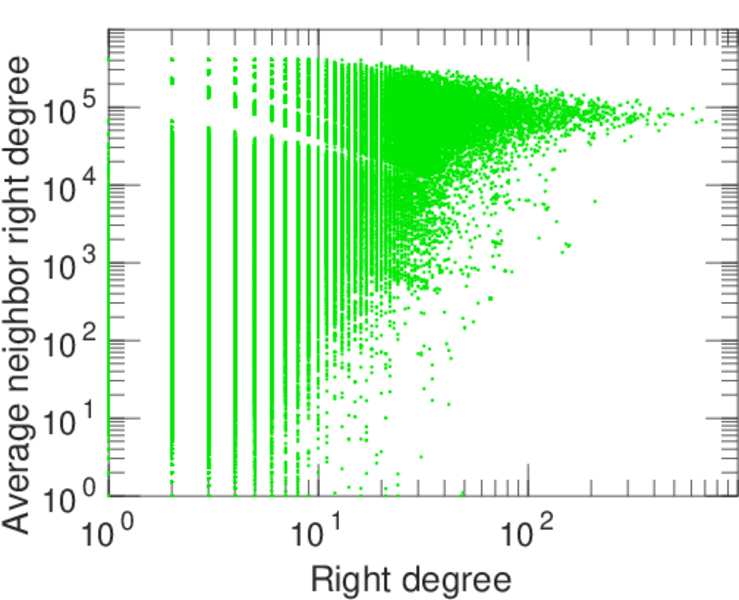
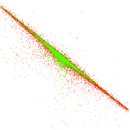
This is the bipartite picture tagging network of vi.sualize.us. Left nodes
represent tags and right nodes represents pictures. An edge connects a picture
with an assigned tag.
Metadata
Statistics
| Size | n = | 577,437
|
| Left size | n1 = | 82,035
|
| Right size | n2 = | 495,402
|
| Volume | m = | 2,298,816
|
| Unique edge count | m̿ = | 1,800,330
|
| Wedge count | s = | 30,601,838,083
|
| Claw count | z = | 1,985,799,614,059,094
|
| Square count | q = | 2,199,351,548
|
| 4-Tour count | T4 = | 140,005,809,036
|
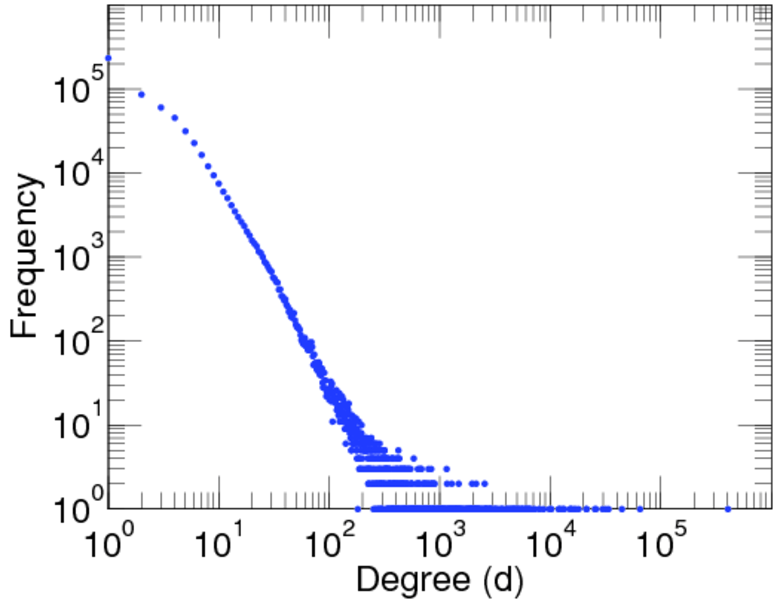
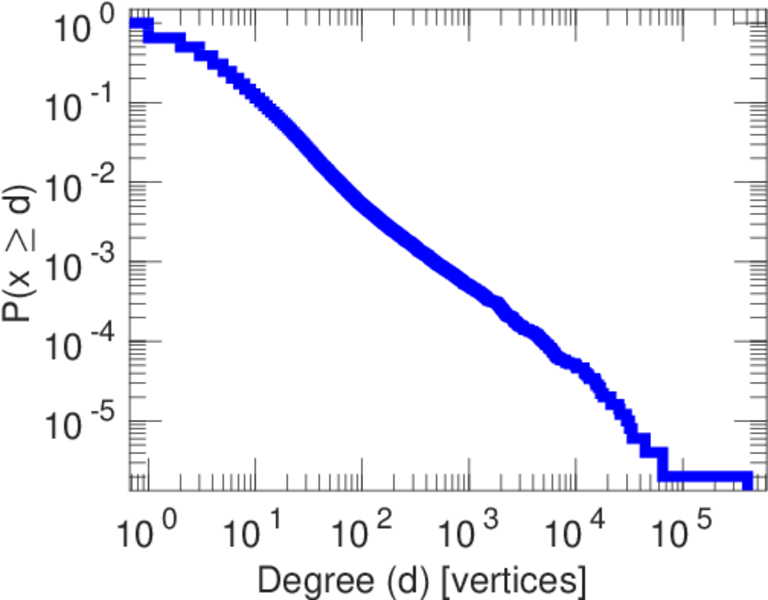
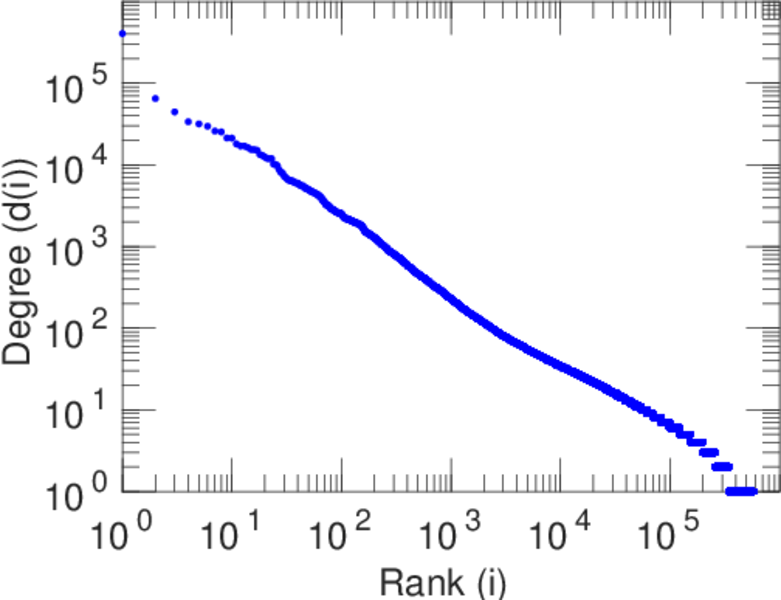
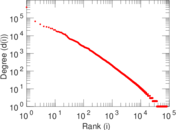
| Maximum degree | dmax = | 405,429
|
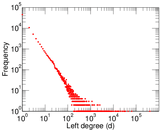
| Maximum left degree | d1max = | 405,429
|
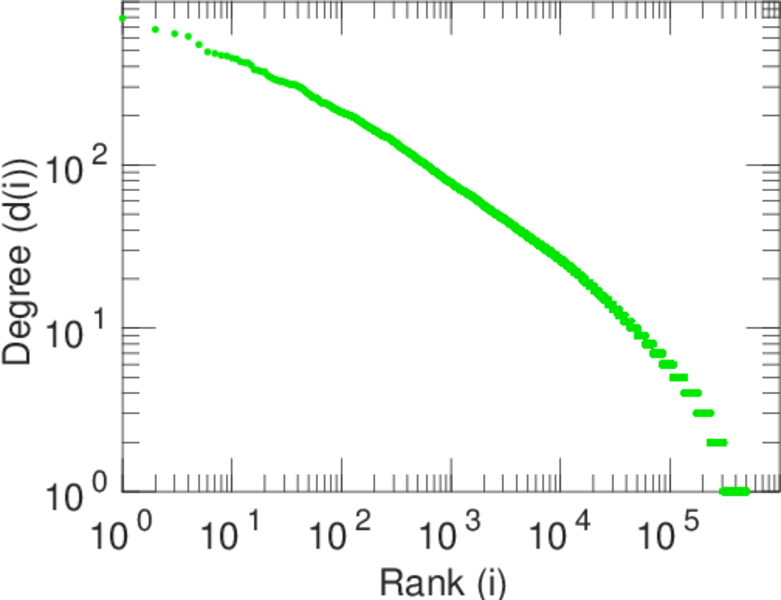
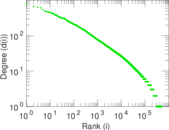
| Maximum right degree | d2max = | 790
|
| Average degree | d = | 7.962 14
|
| Average left degree | d1 = | 28.022 4
|
| Average right degree | d2 = | 4.640 30
|
| Fill | p = | 4.429 91 × 10−5
|
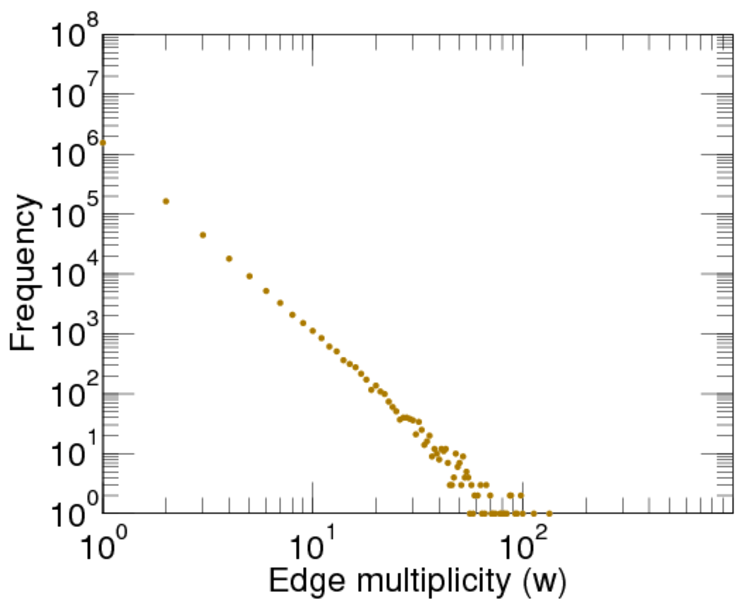
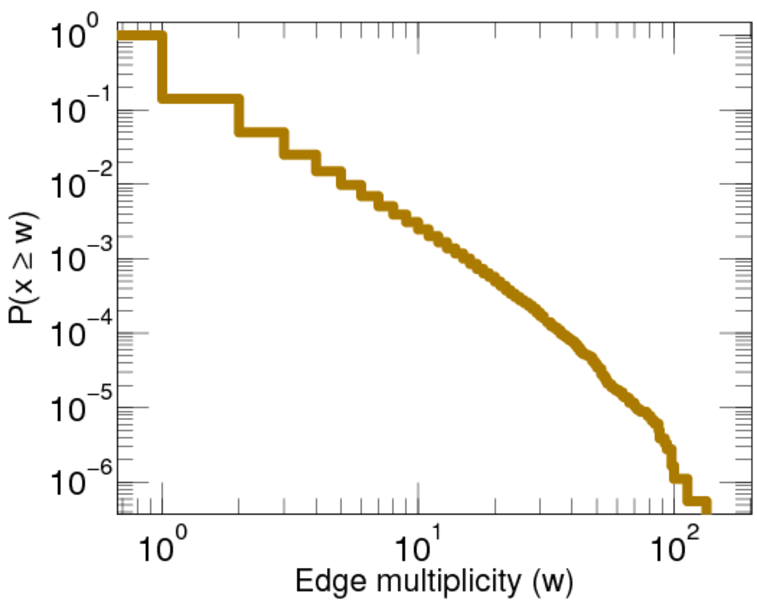
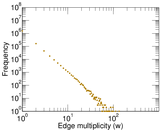
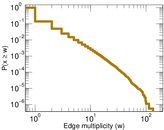
| Average edge multiplicity | m̃ = | 1.276 89
|
| Size of LCC | N = | 564,218
|
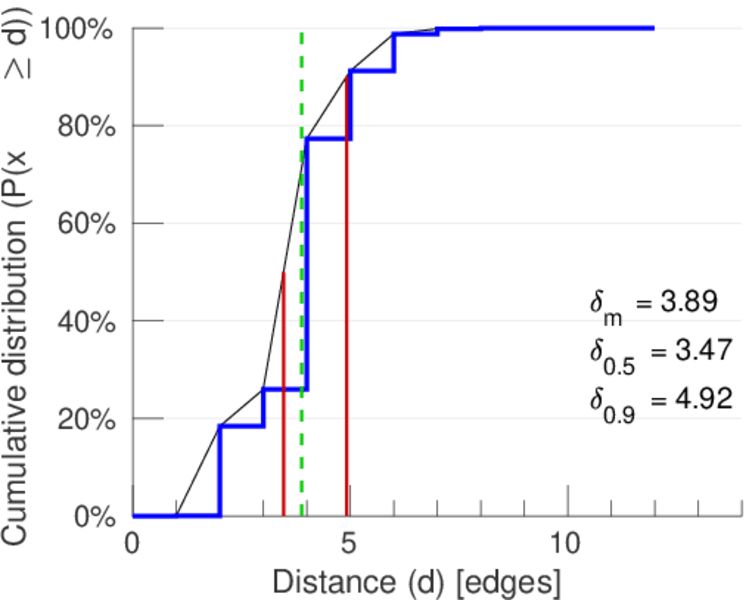
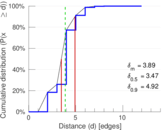
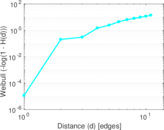
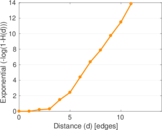
| Diameter | δ = | 17
|
| 50-Percentile effective diameter | δ0.5 = | 3.468 93
|
| 90-Percentile effective diameter | δ0.9 = | 4.915 48
|
| Median distance | δM = | 4
|
| Mean distance | δm = | 3.887 09
|
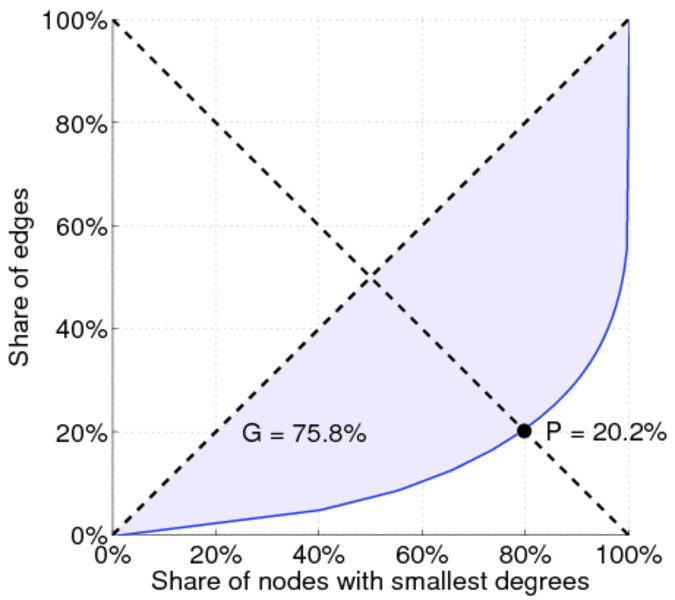
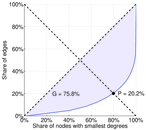
| Gini coefficient | G = | 0.764 600
|
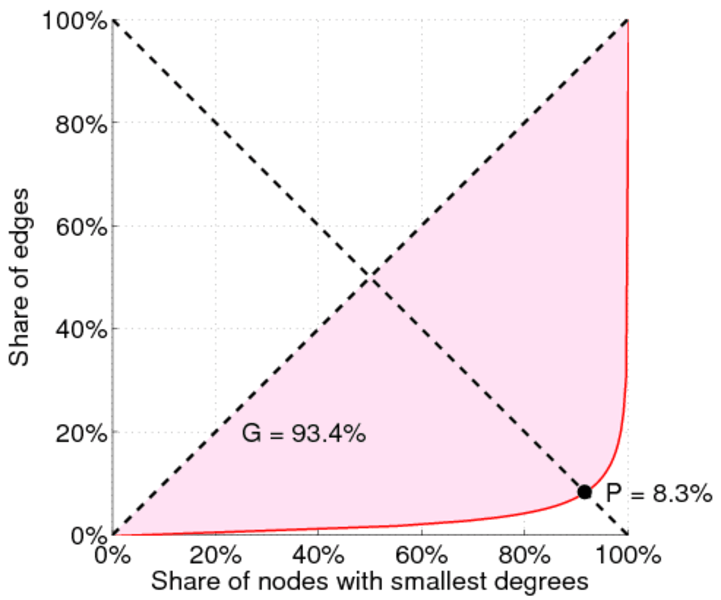
| Balanced inequality ratio | P = | 0.201 174
|
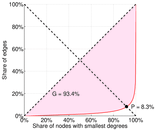
| Left balanced inequality ratio | P1 = | 0.083 396 4
|
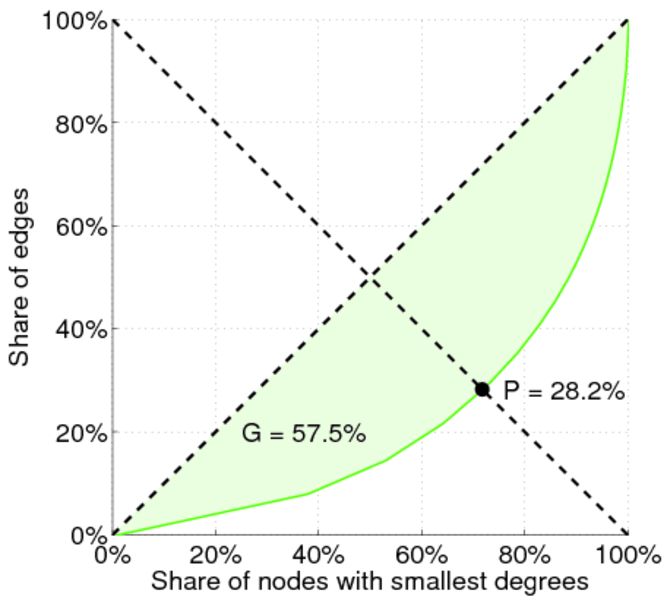
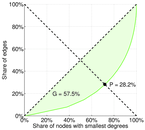
| Right balanced inequality ratio | P2 = | 0.282 309
|
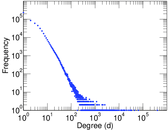
| Tail power law exponent | γt = | 2.591 00
|
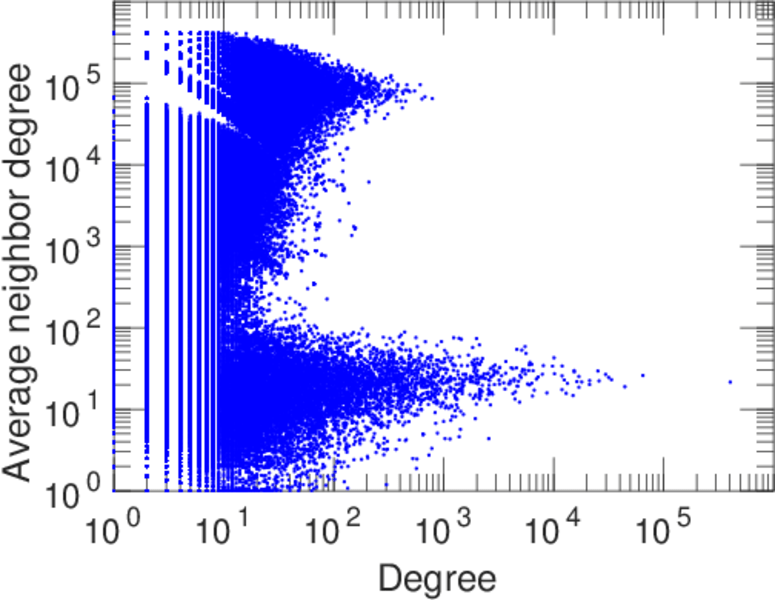
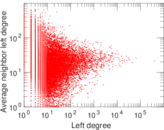
| Degree assortativity | ρ = | −0.167 621
|
| Degree assortativity p-value | pρ = | 0.000 00
|
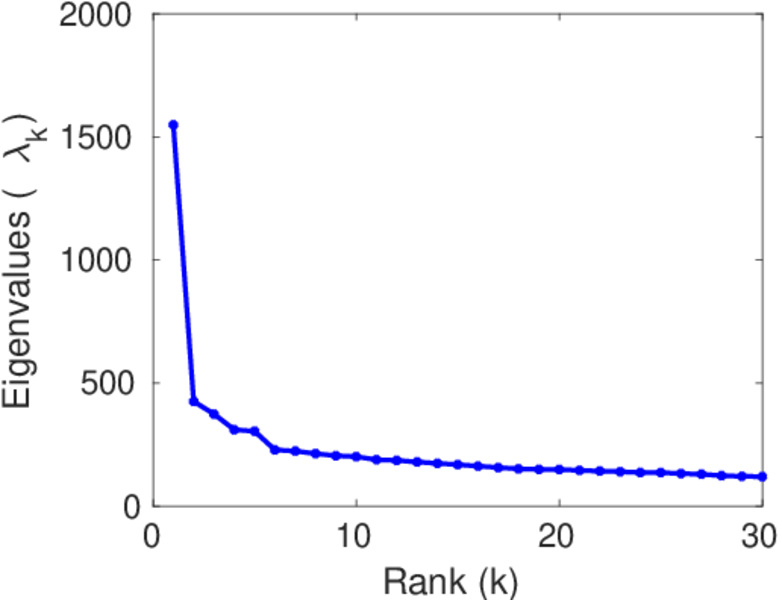
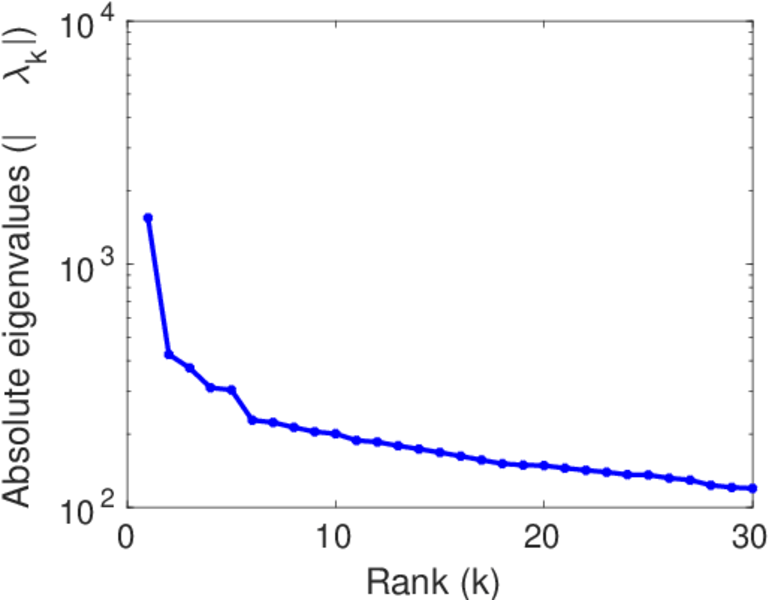
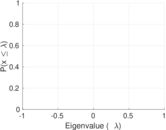
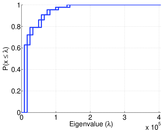
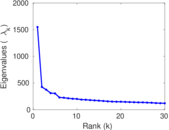
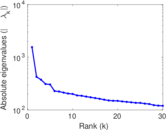
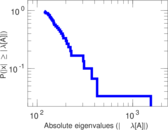
| Spectral norm | α = | 1,548.34
|
| Algebraic connectivity | a = | 0.009 718 28
|
| Spectral separation | |λ1[A] / λ2[A]| = | 3.644 49
|
| Controllability | C = | 442,519
|
| Relative controllability | Cr = | 0.766 350
|
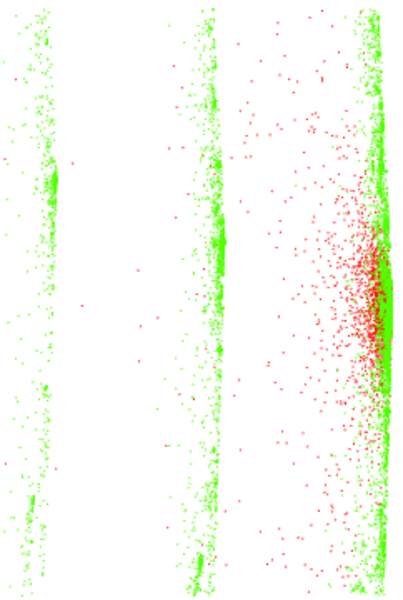
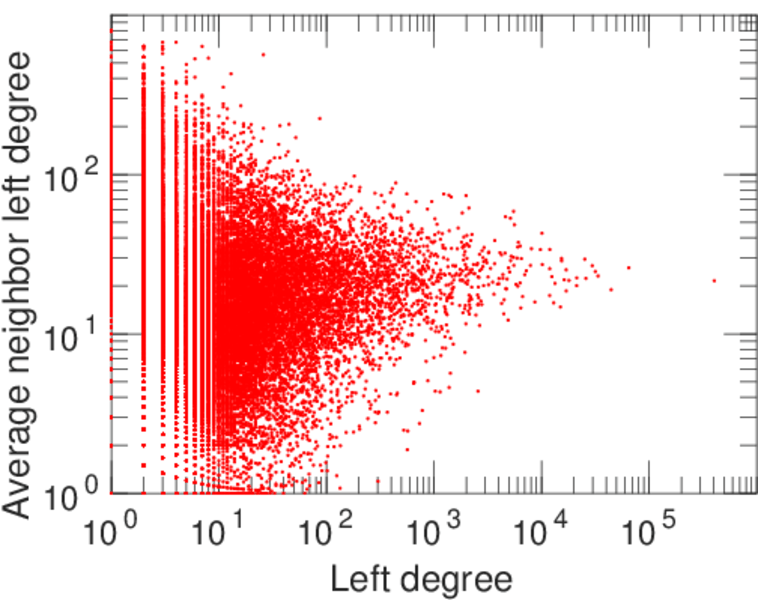
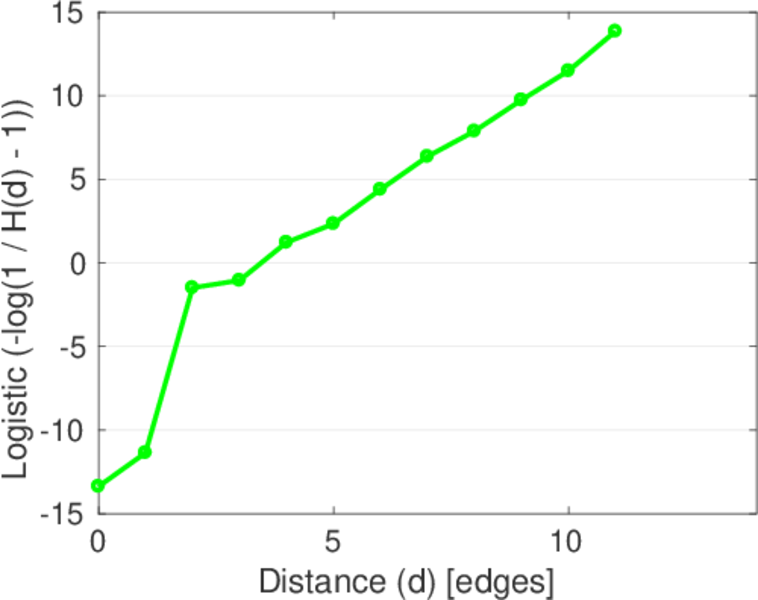
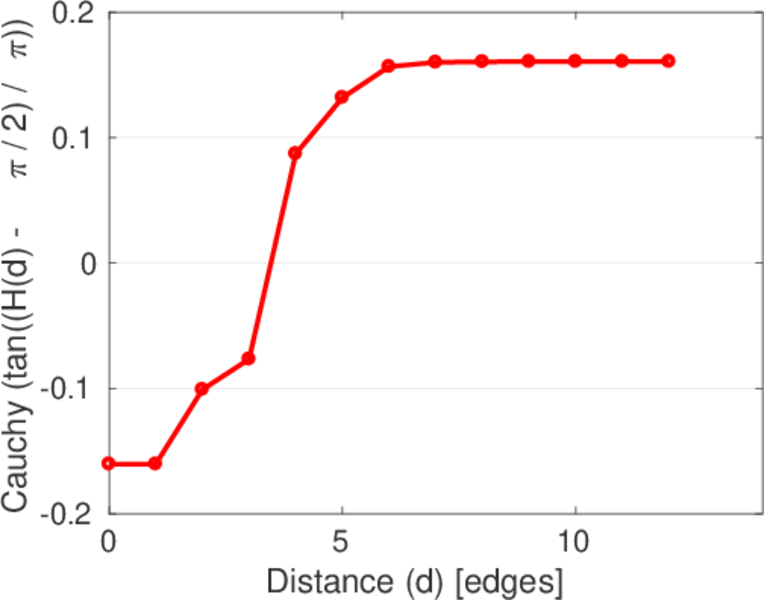
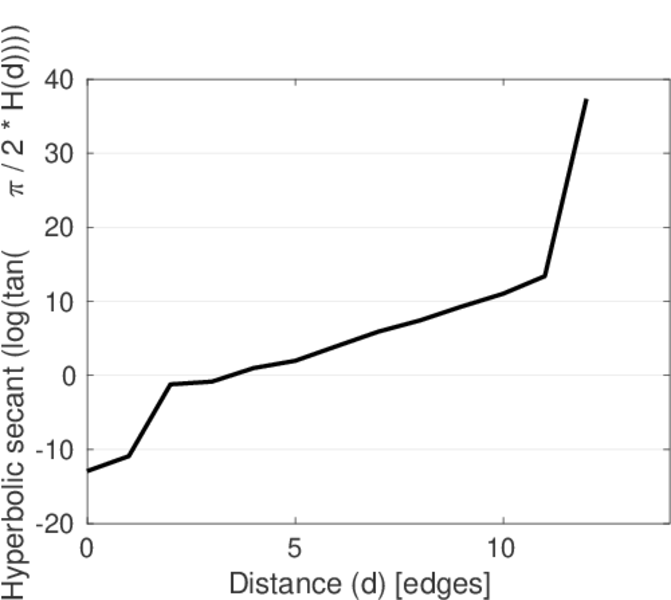
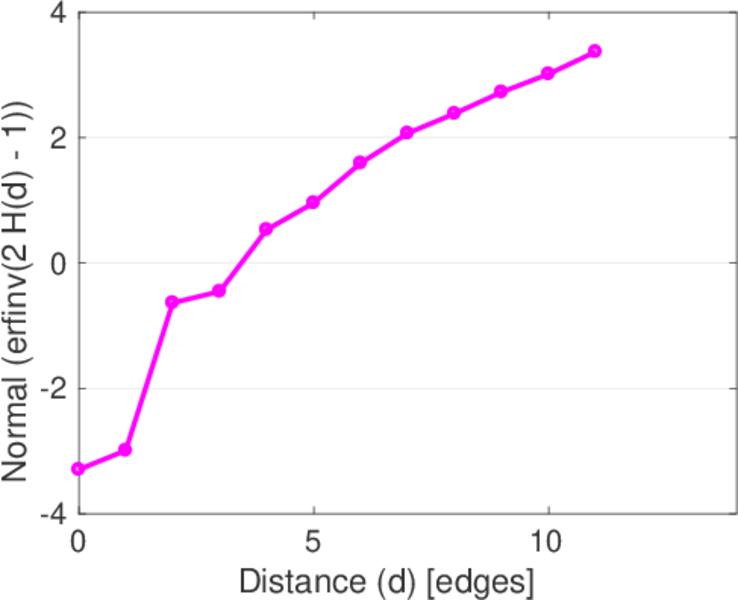
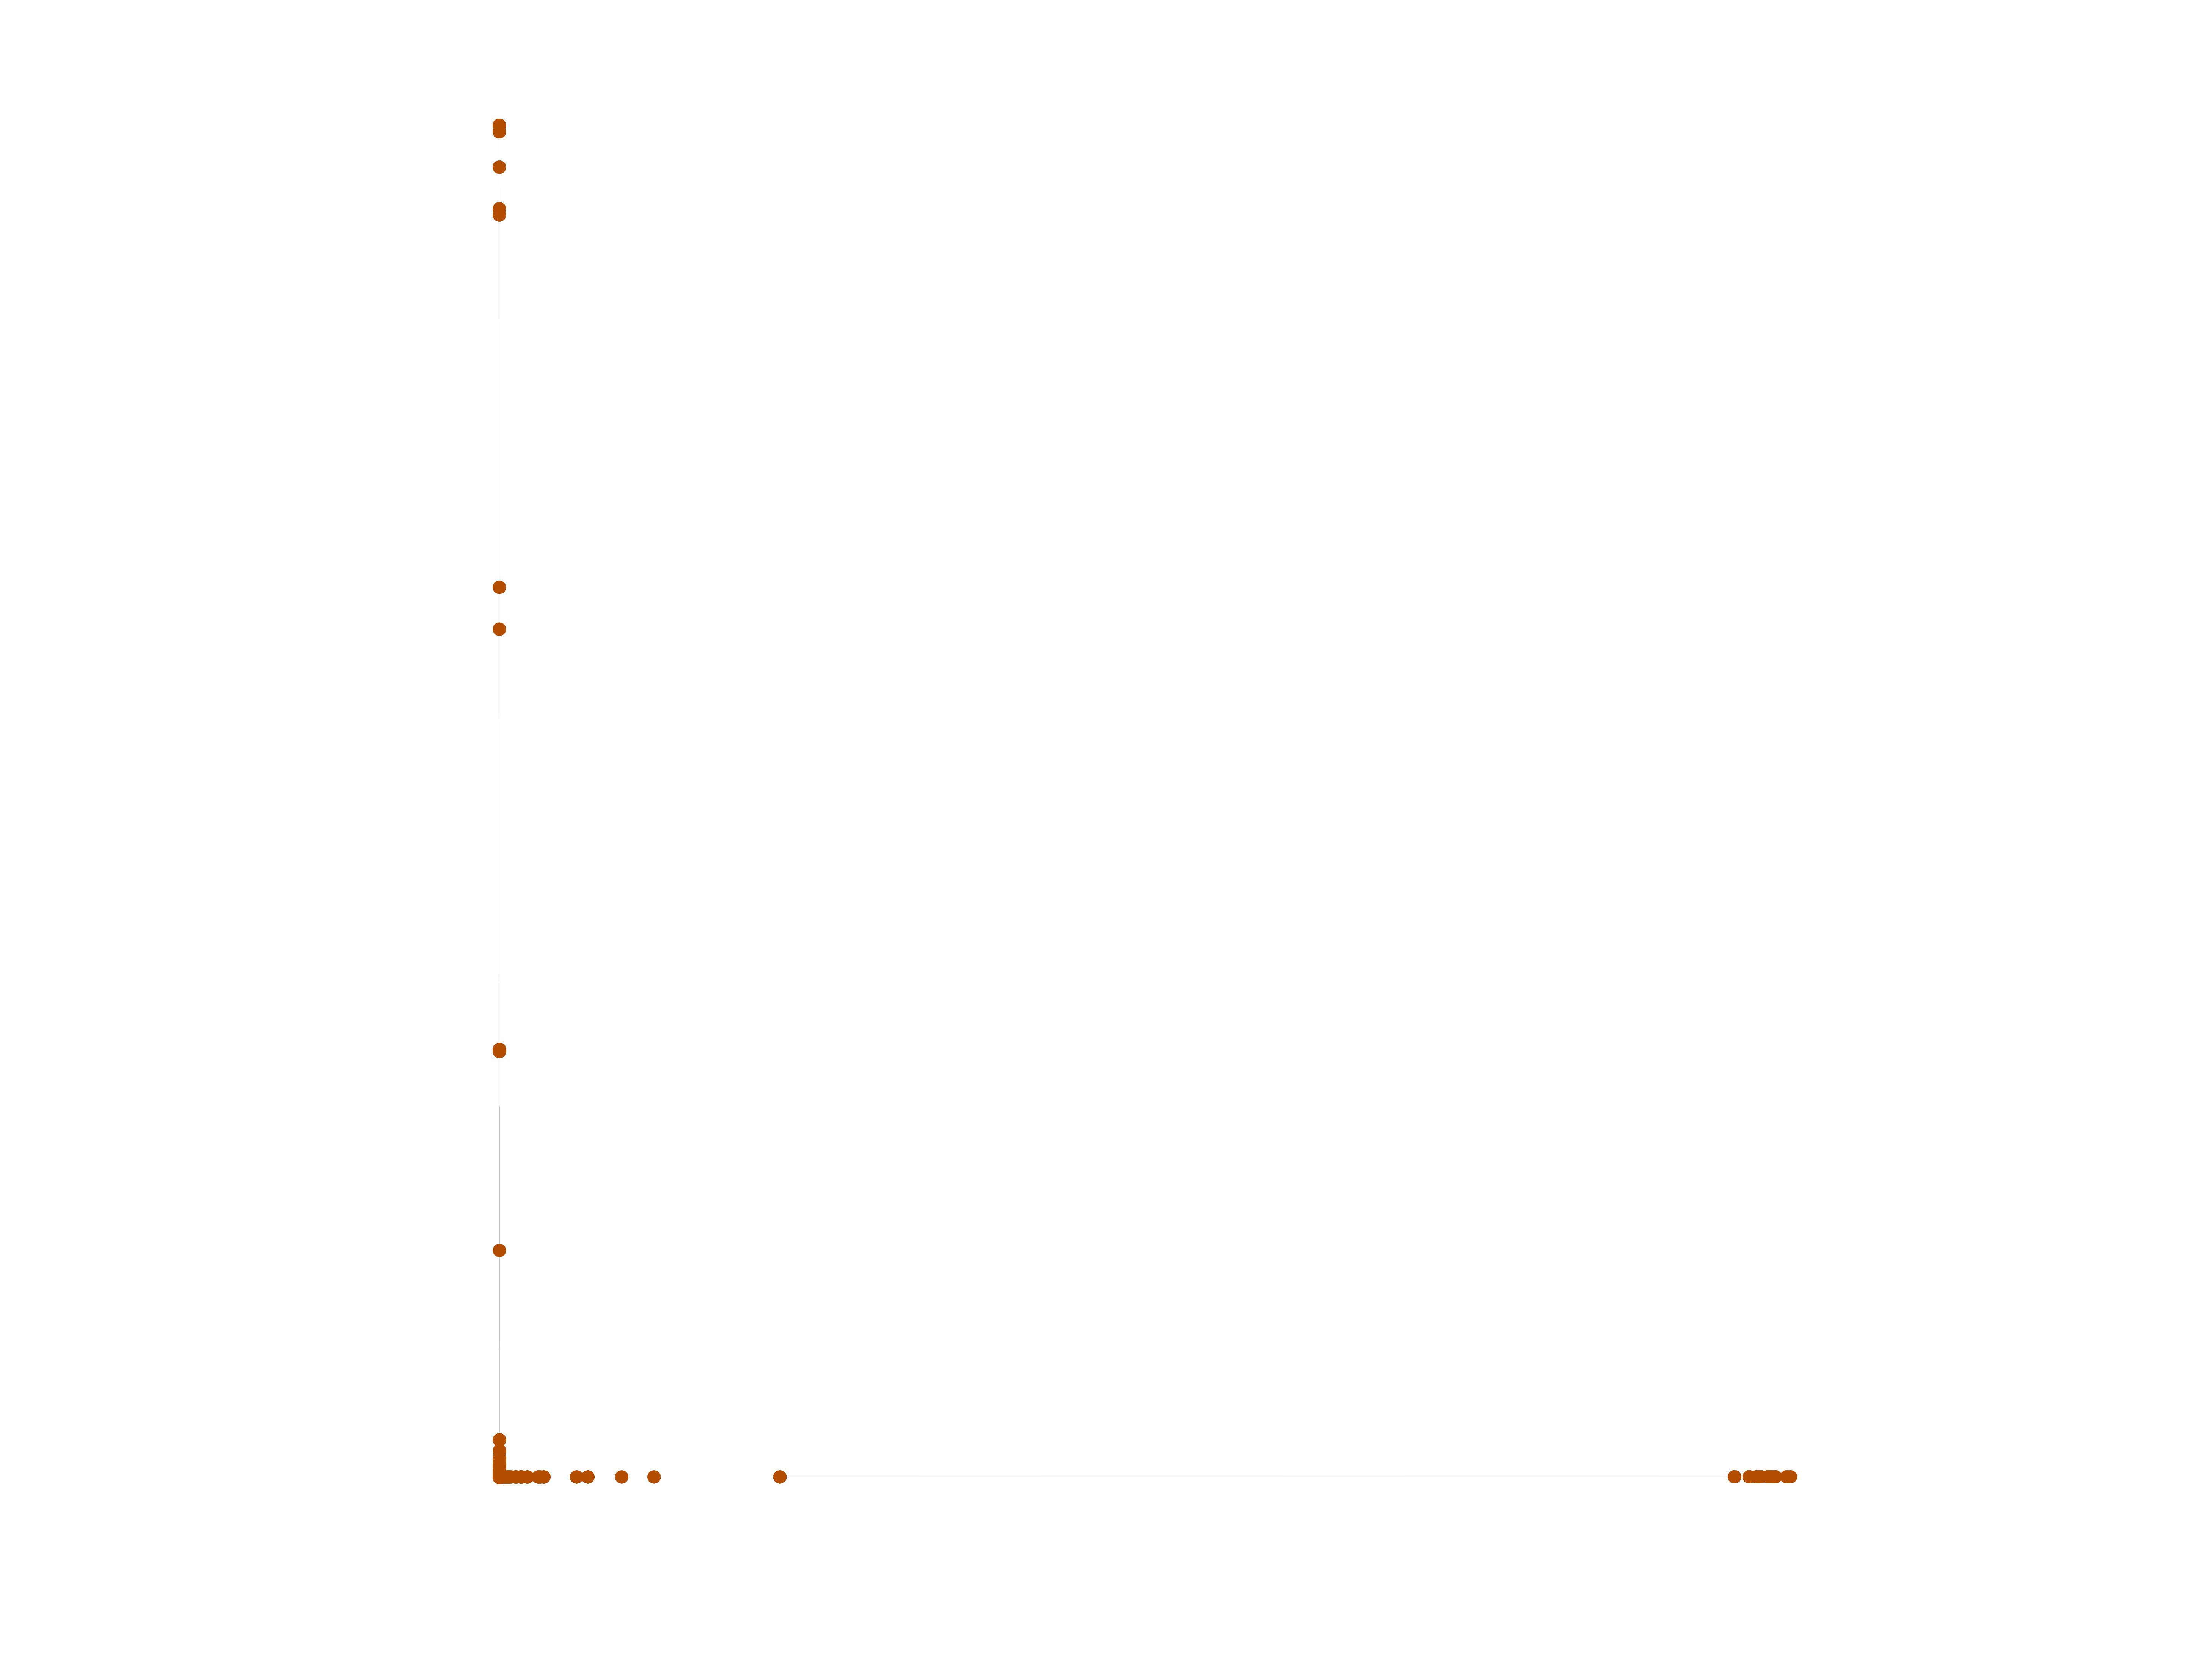
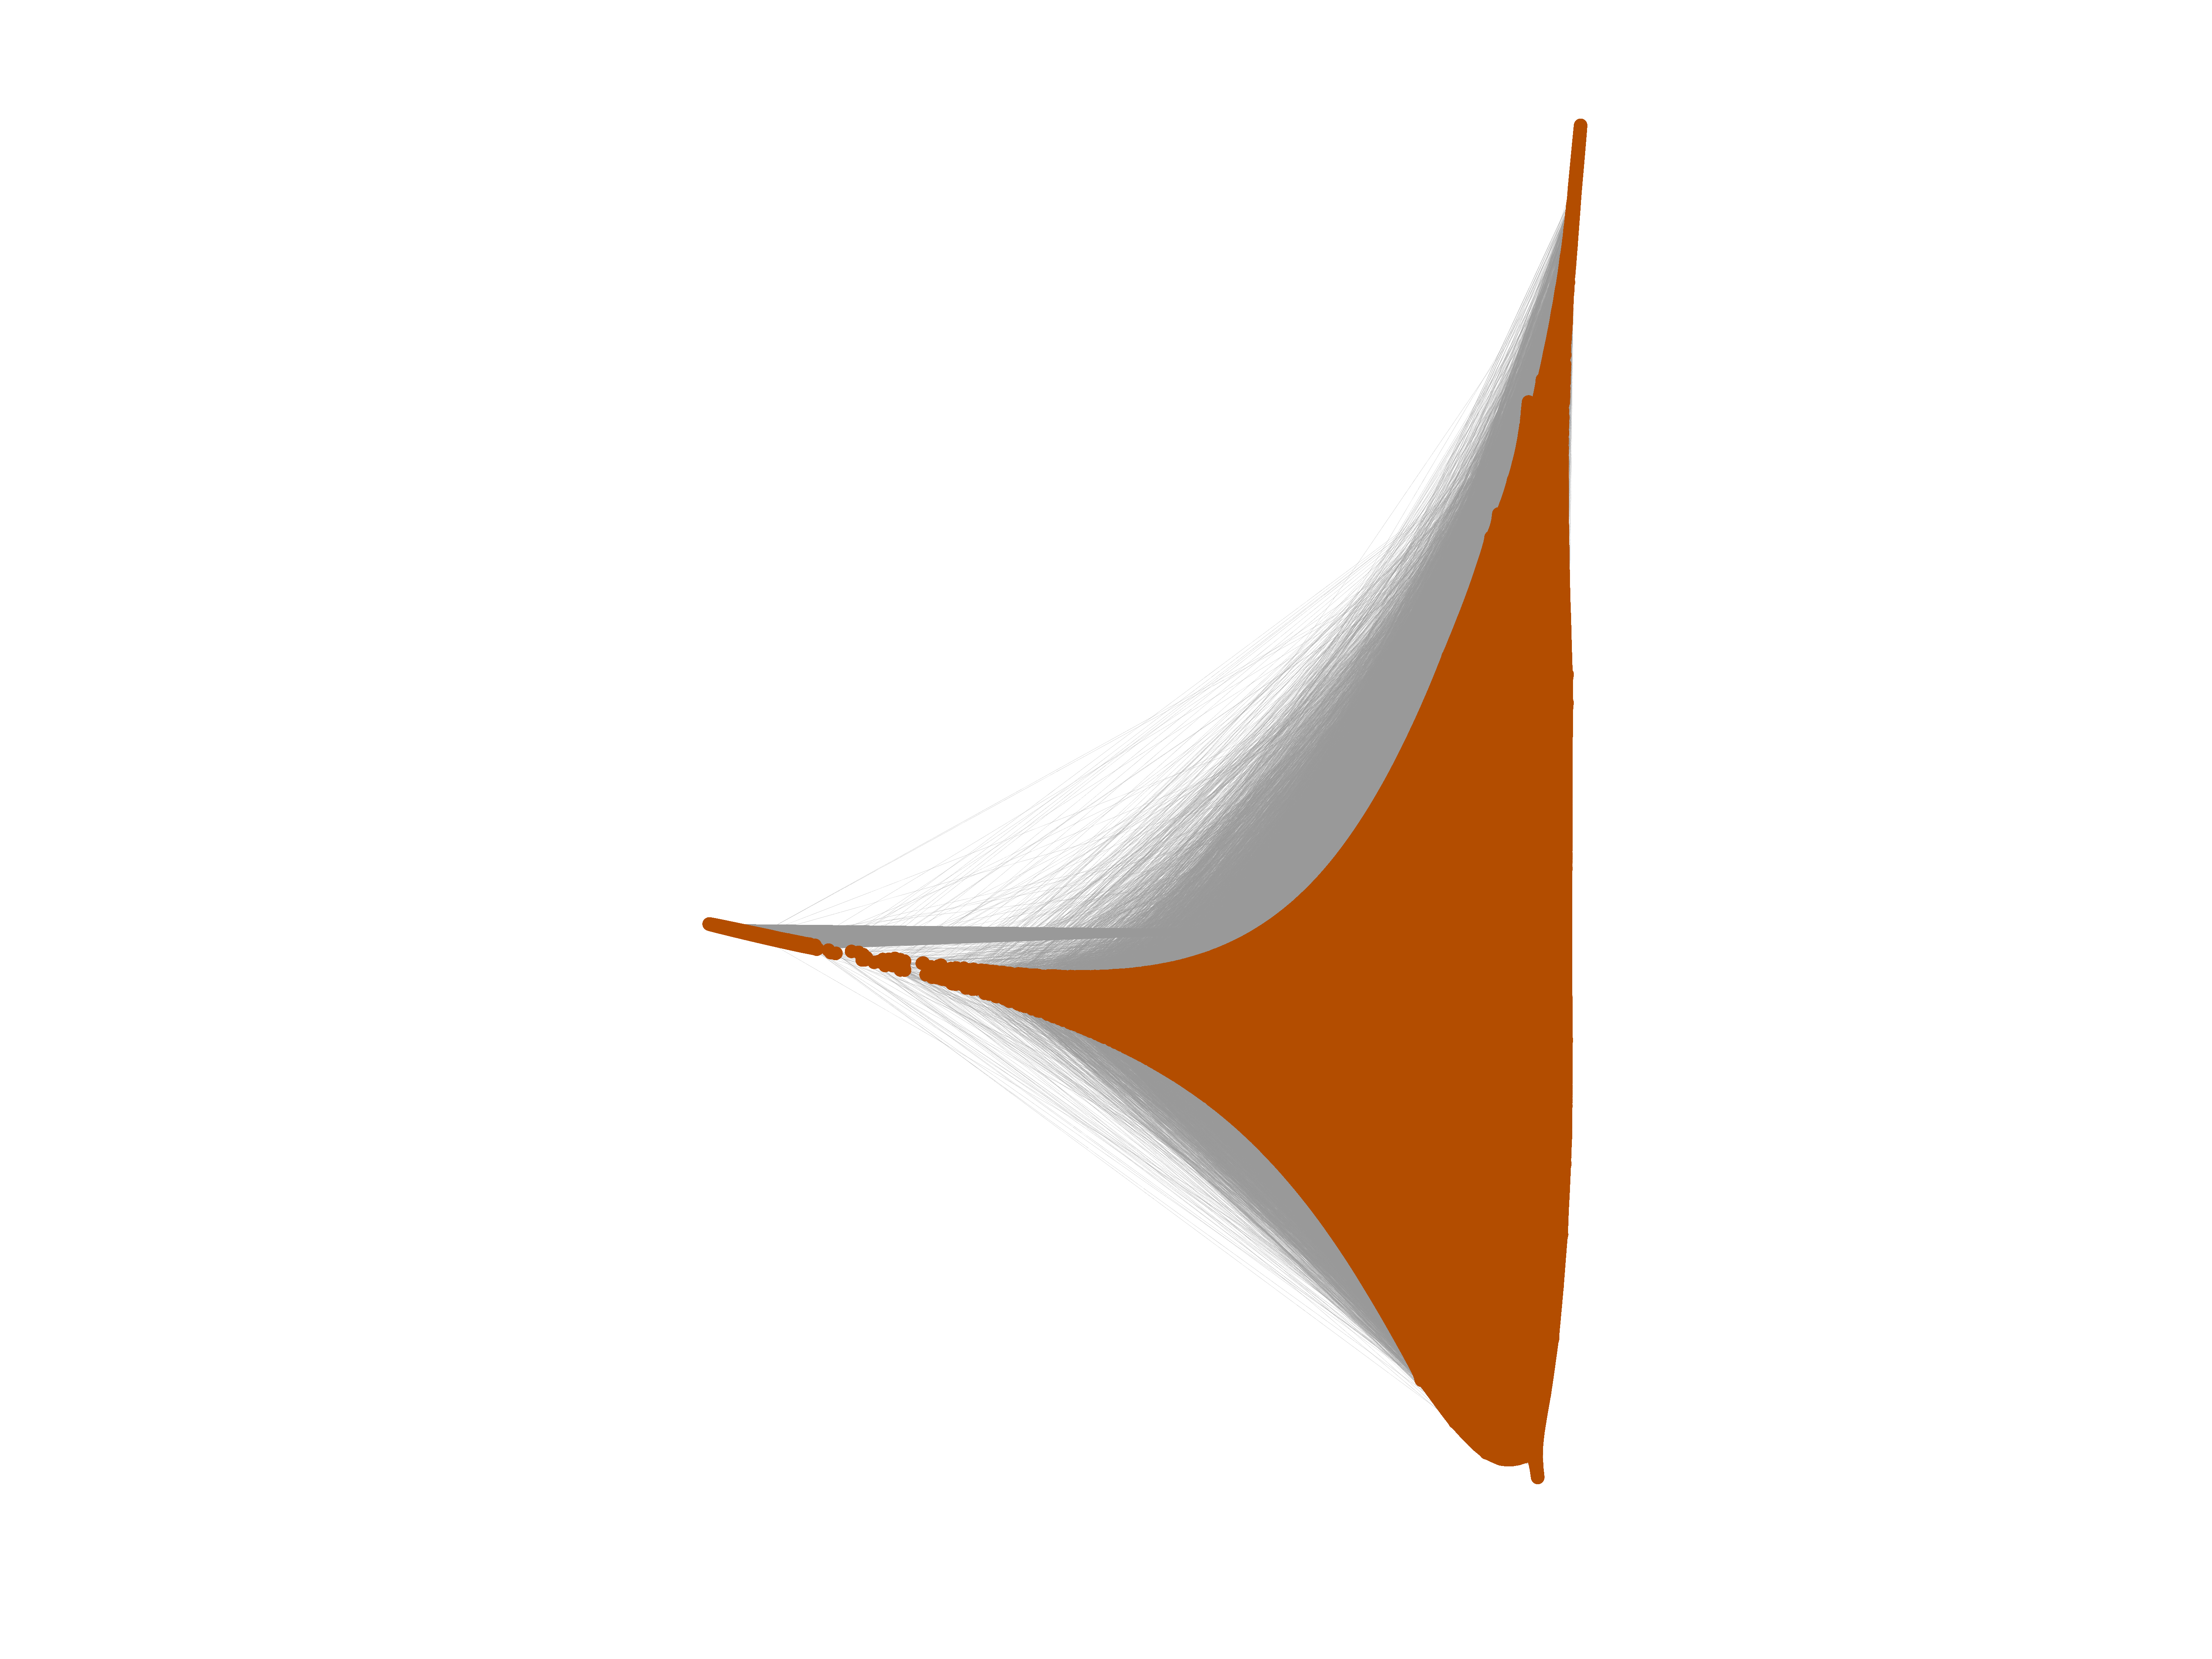
Plots


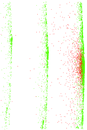
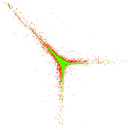


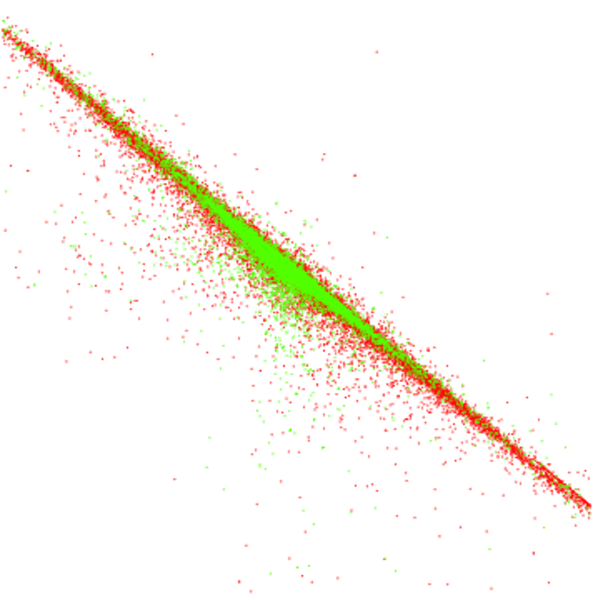
Matrix decompositions plots
Downloads
References
|
[1]
|
Jérôme Kunegis.
KONECT – The Koblenz Network Collection.
In Proc. Int. Conf. on World Wide Web Companion, pages
1343–1350, 2013.
[ http ]
|
|
[2]
|
Nicolas Neubauer and Klaus Obermayer.
Analysis of the Visualize.us folksonomy.
Unpublished, 2010.
|
 KONECT ‣ Networks ‣
Buy Me a Coffee
KONECT ‣ Networks ‣
Buy Me a Coffee