Wikipedia dynamic (nl)
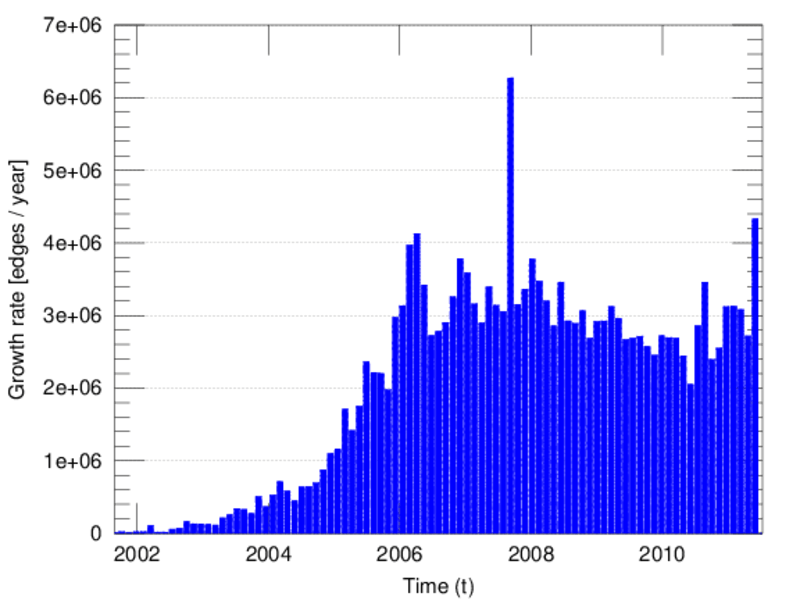
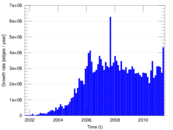
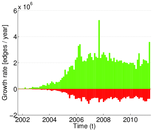
This network shows the evolution of hyperlinks between articles of the Dutch
Wikipedia. The nodes represent articles. An edge indicates that a hyperlink was
added or removed depending on the edge weight (−1 for removal or +1 for
addition).
Metadata
Statistics
| Size | n = | 1,039,252
|
| Volume | m = | 20,070,561
|
| Unique edge count | m̿ = | 10,612,491
|
| Loop count | l = | 903
|
| Wedge count | s = | 21,187,791,948
|
| Claw count | z = | 165,987,909,016,829
|
| Cross count | x = | 2,149,013,466,337,388,800
|
| Triangle count | t = | 38,474,538
|
| Square count | q = | 9,487,566,269
|
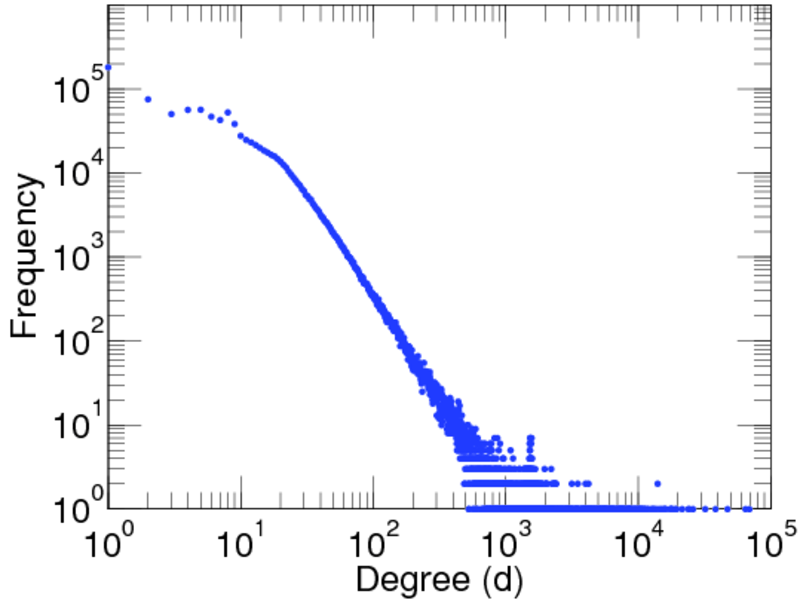
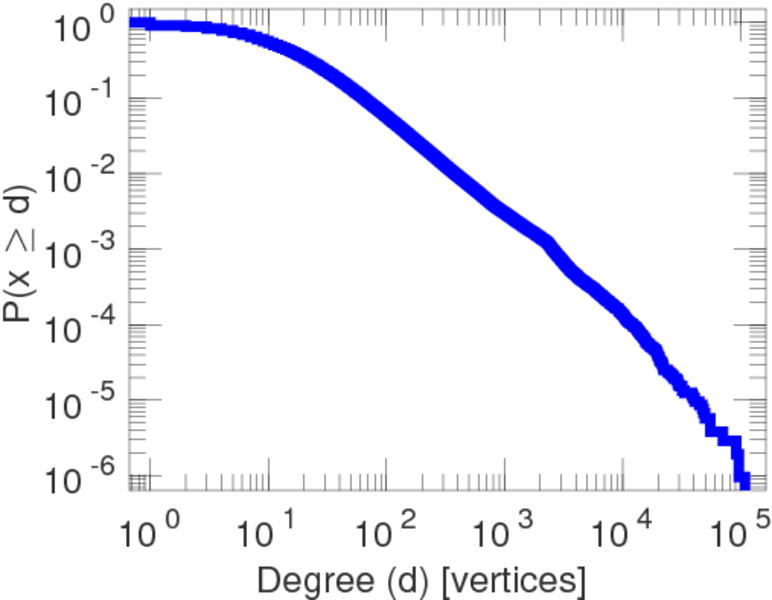
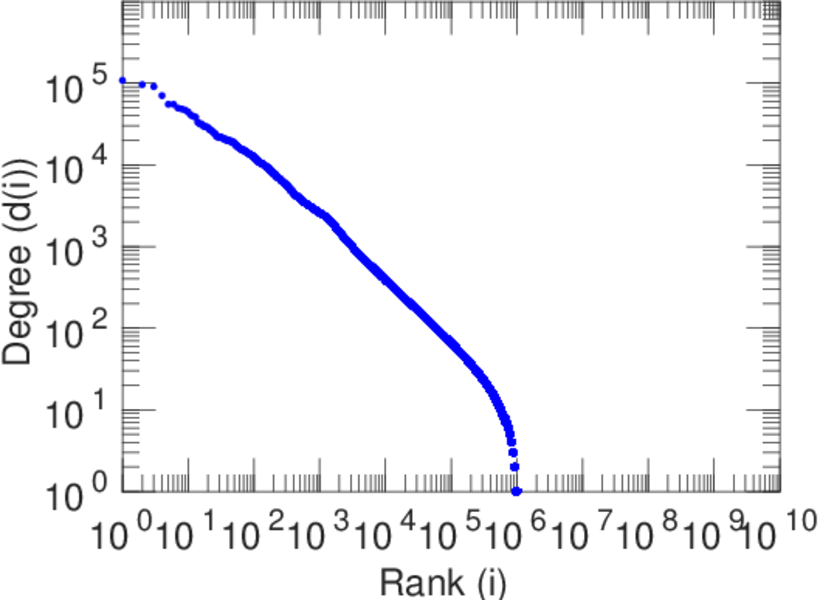
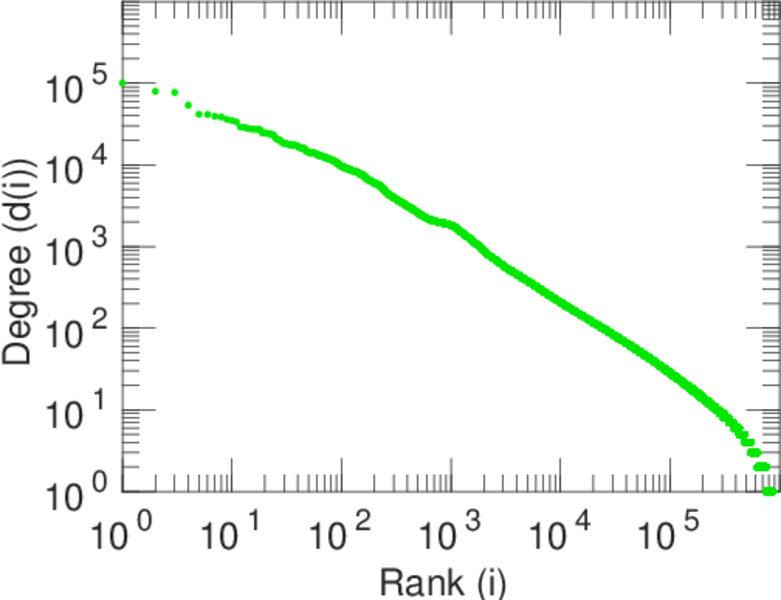
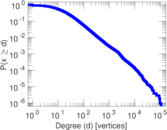
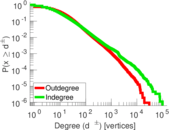
| Maximum degree | dmax = | 108,306
|
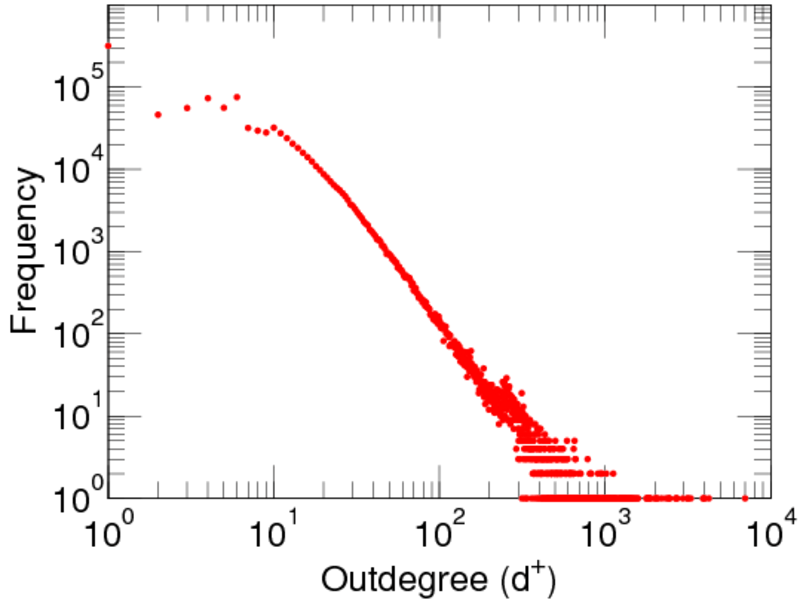
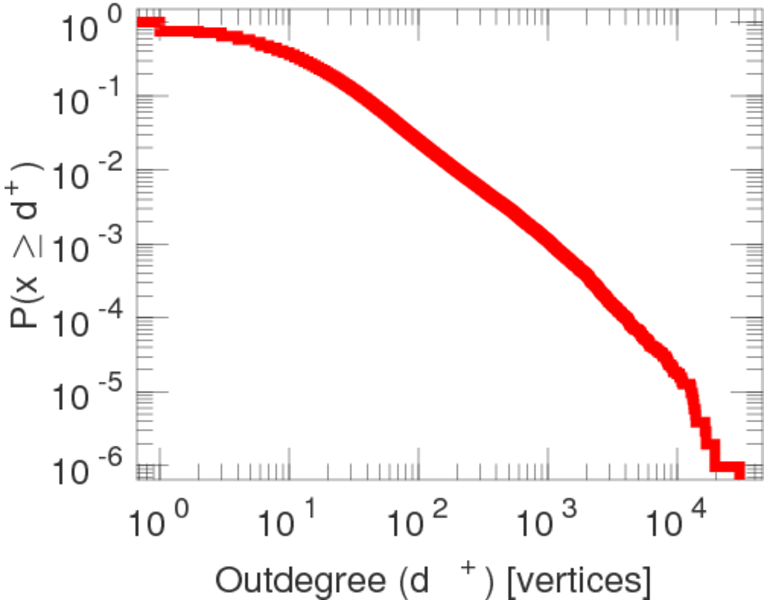
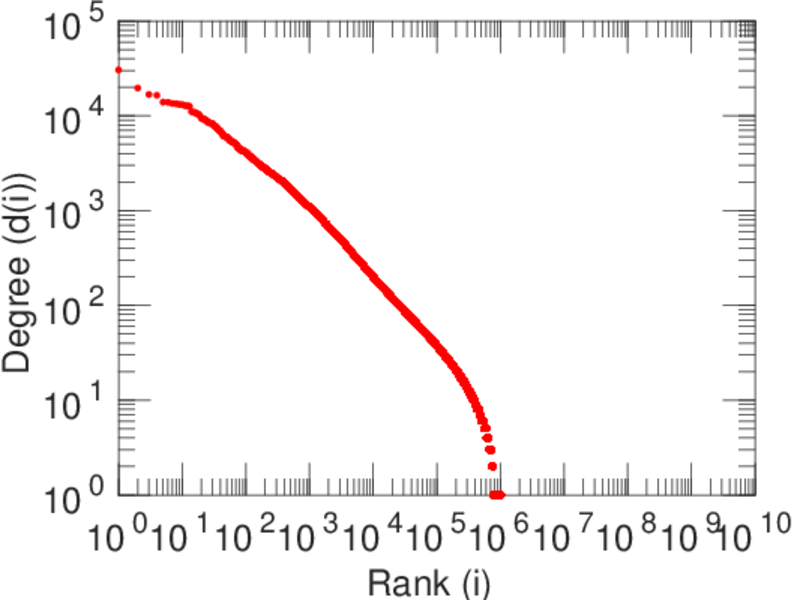
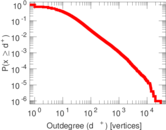
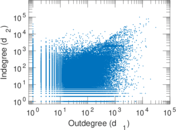
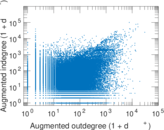
| Maximum outdegree | d+max = | 30,455
|
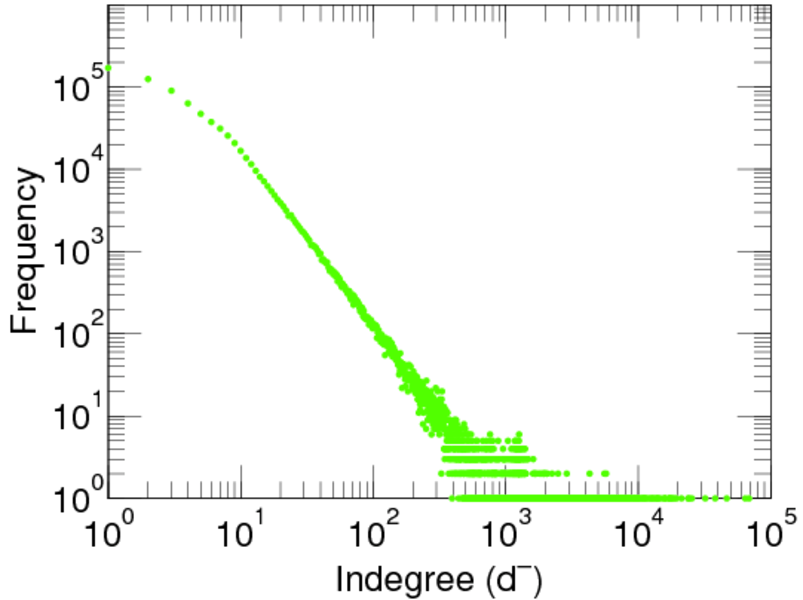
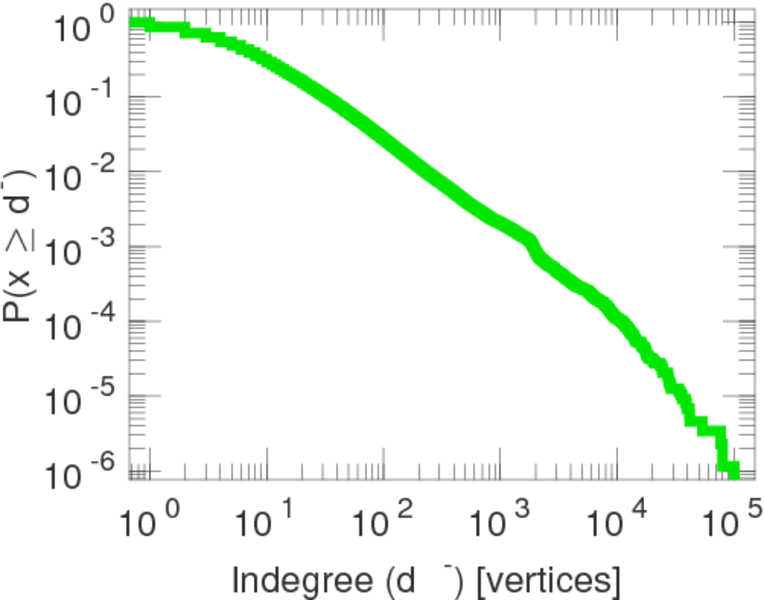
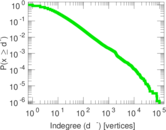
| Maximum indegree | d−max = | 100,534
|
| Average degree | d = | 38.625 0
|
| Fill | p = | 9.901 82 × 10−6
|
| Average edge multiplicity | m̃ = | 1.891 22
|
| Size of LCC | N = | 1,038,209
|
| Size of LSCC | Ns = | 719,510
|
| Relative size of LSCC | Nrs = | 0.692 334
|
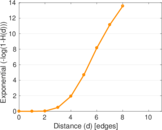
| Diameter | δ = | 13
|
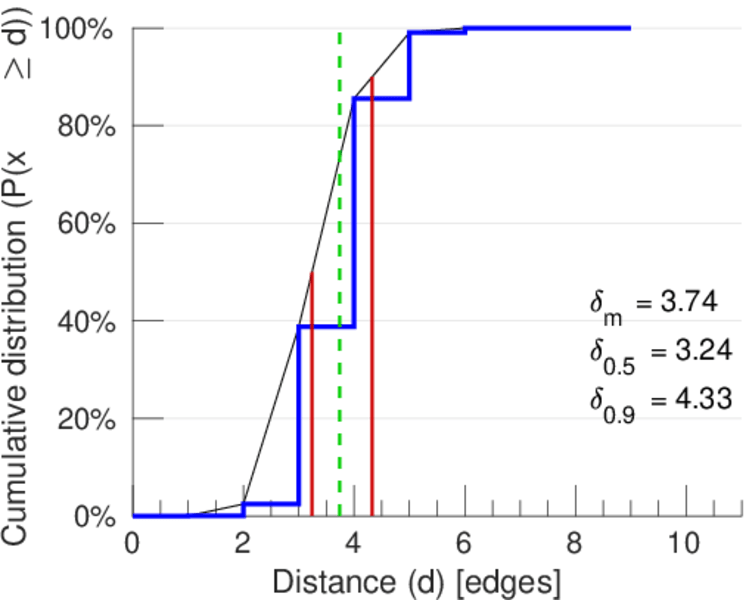
| 50-Percentile effective diameter | δ0.5 = | 3.240 00
|
| 90-Percentile effective diameter | δ0.9 = | 4.327 86
|
| Median distance | δM = | 4
|
| Mean distance | δm = | 3.741 74
|
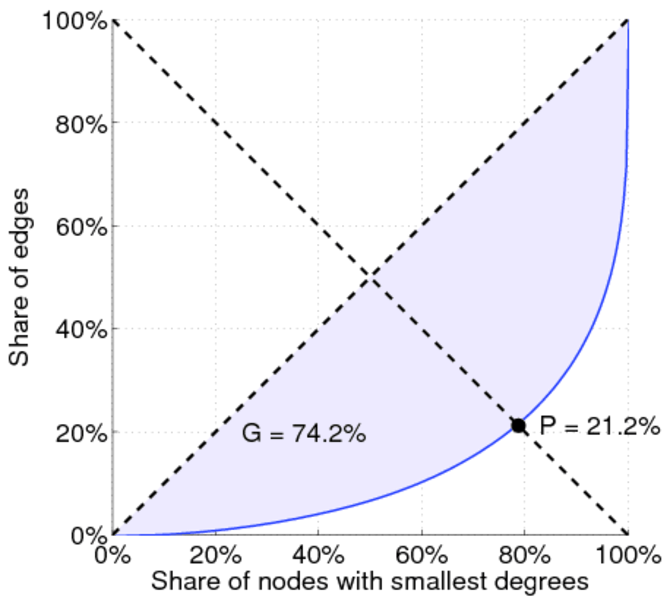
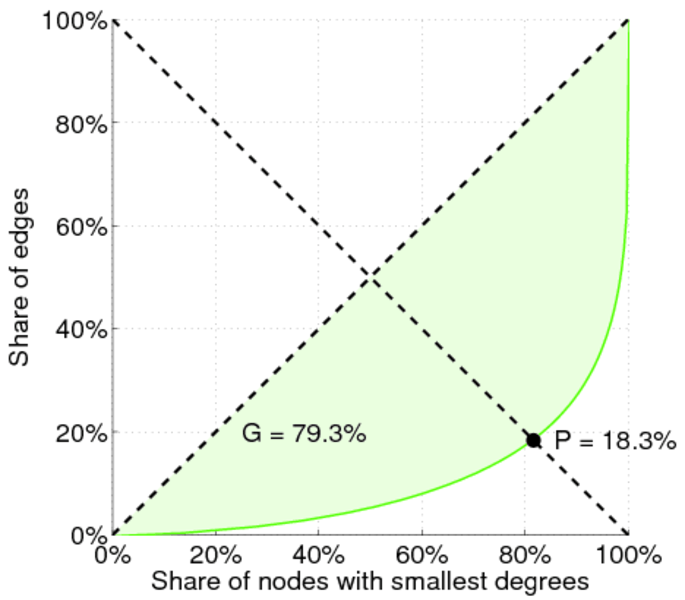
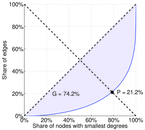
| Gini coefficient | G = | 0.708 110
|
| Balanced inequality ratio | P = | 0.234 067
|
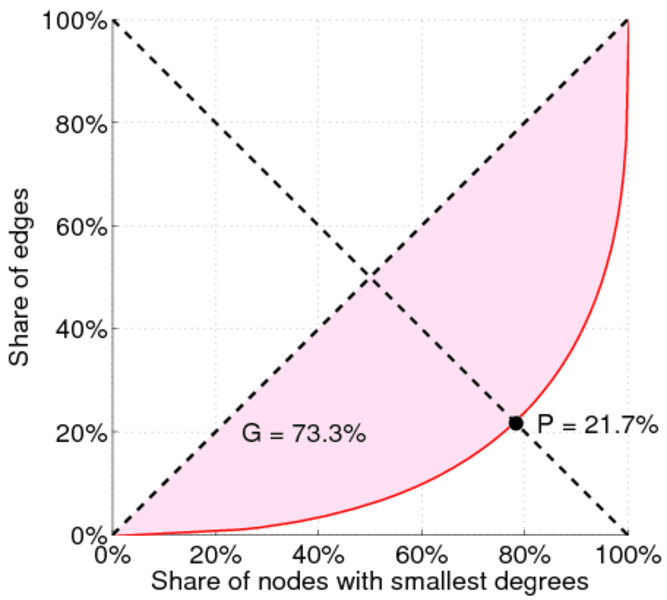
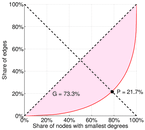
| Outdegree balanced inequality ratio | P+ = | 0.255 756
|
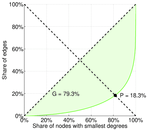
| Indegree balanced inequality ratio | P− = | 0.194 656
|
| Relative edge distribution entropy | Her = | 0.892 251
|
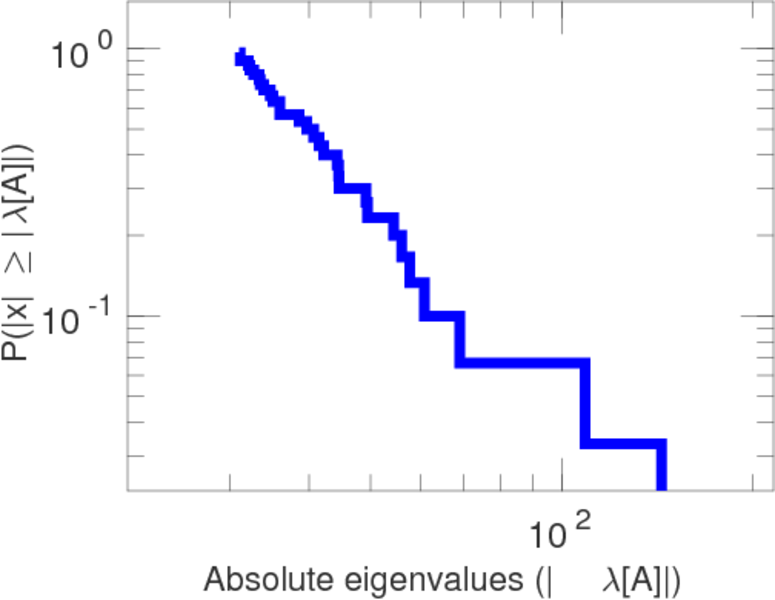
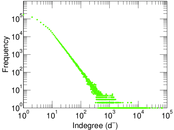
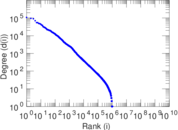
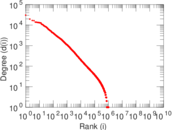
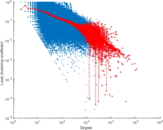
| Power law exponent | γ = | 1.529 90
|
| Tail power law exponent | γt = | 2.431 00
|
| Degree assortativity | ρ = | −0.053 008 8
|
| Degree assortativity p-value | pρ = | 0.000 00
|
| In/outdegree correlation | ρ± = | +0.607 794
|
| Clustering coefficient | c = | 0.005 447 65
|
| Directed clustering coefficient | c± = | 0.029 318 3
|
| Spectral norm | α = | 479.901
|
| Operator 2-norm | ν = | 368.130
|
| Cyclic eigenvalue | π = | 143.737
|
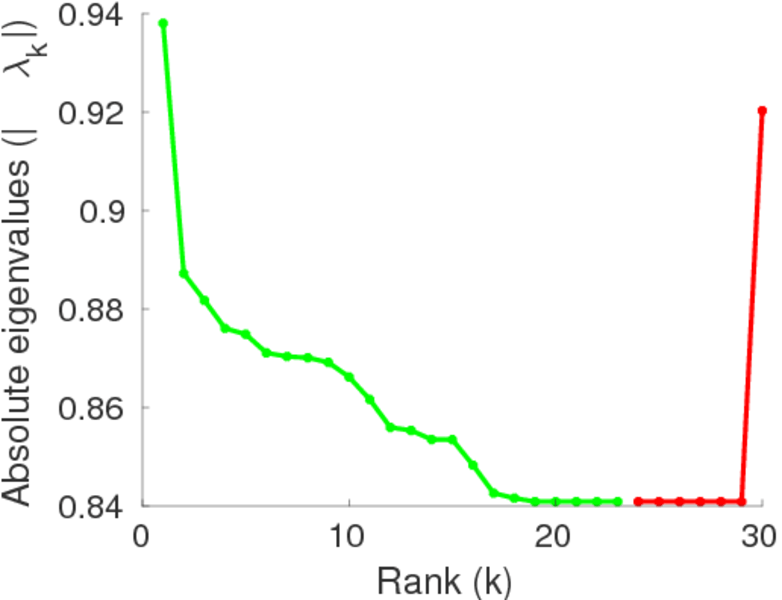
| Spectral separation | |λ1[A] / λ2[A]| = | 1.350 50
|
| Reciprocity | y = | 0.178 834
|
| Non-bipartivity | bA = | 0.259 531
|
| Normalized non-bipartivity | bN = | 0.018 706 0
|
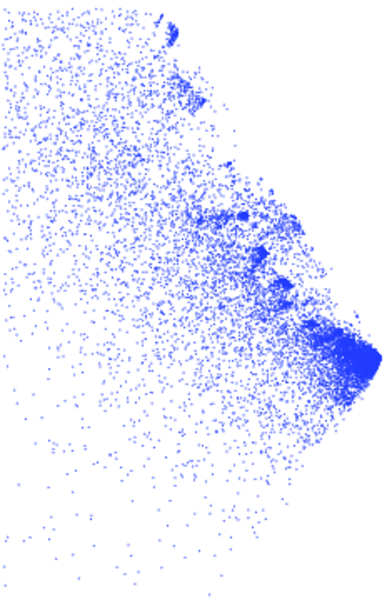
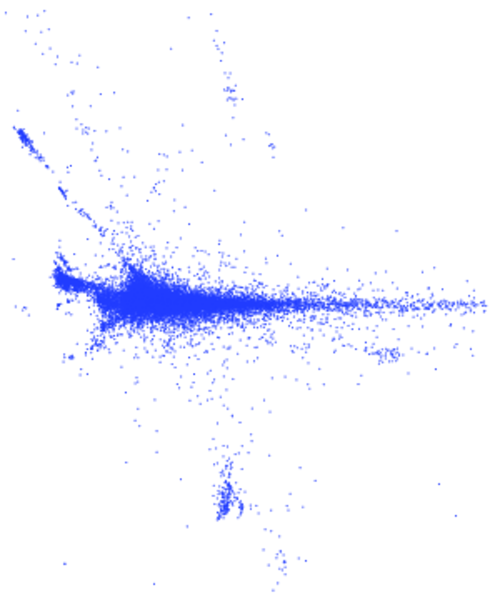
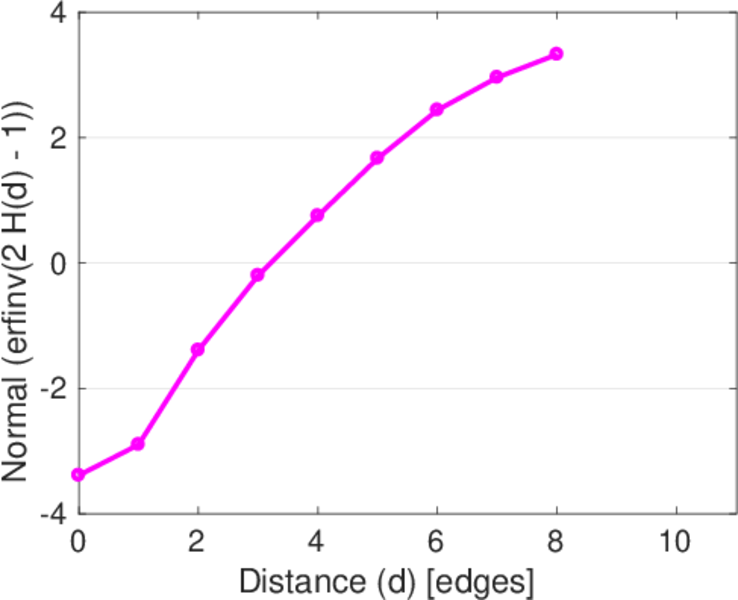
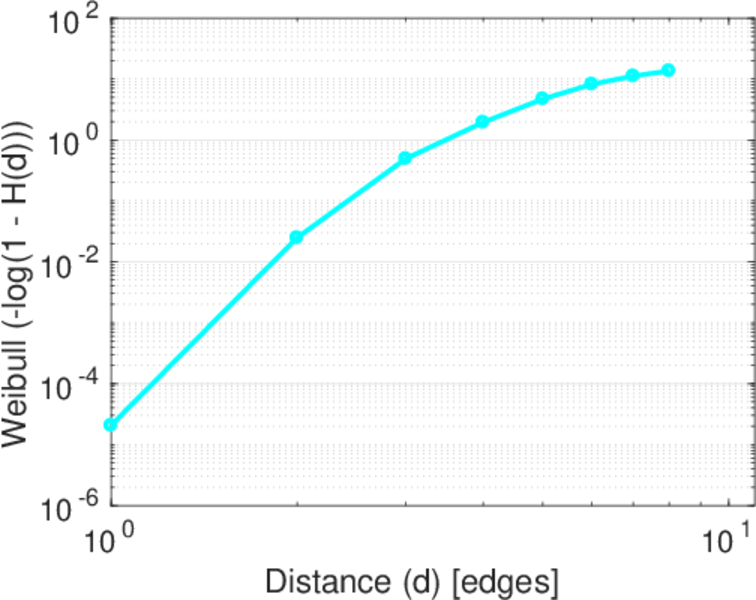
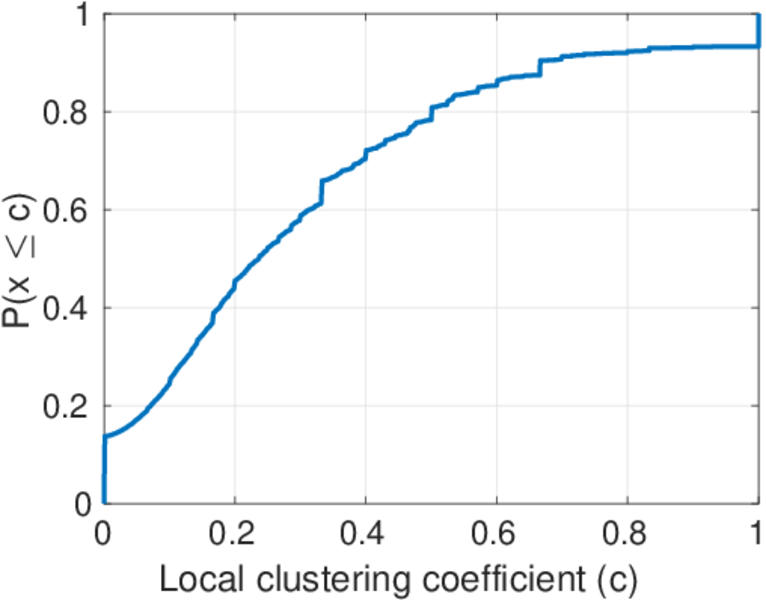
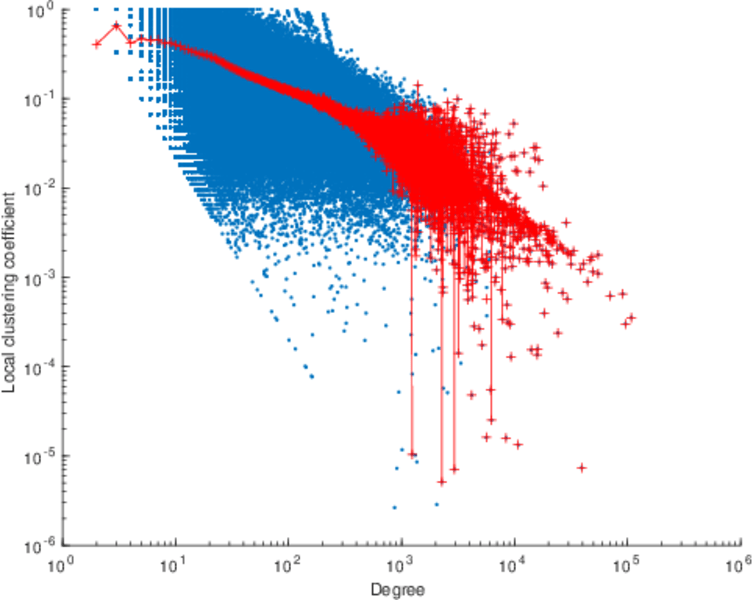
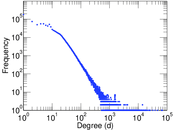
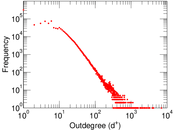
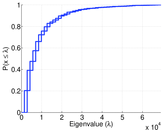
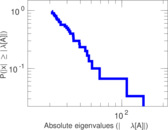
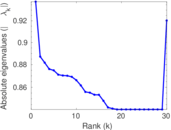
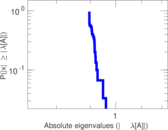
Plots


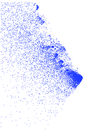
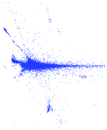


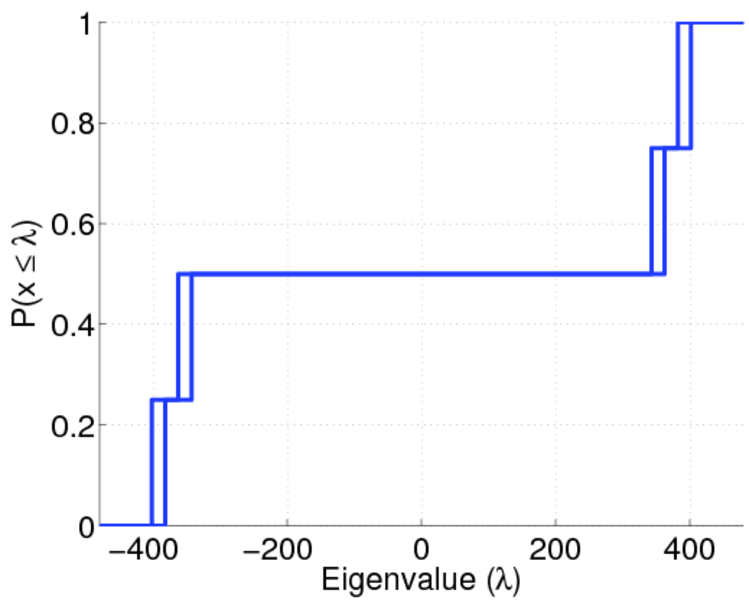
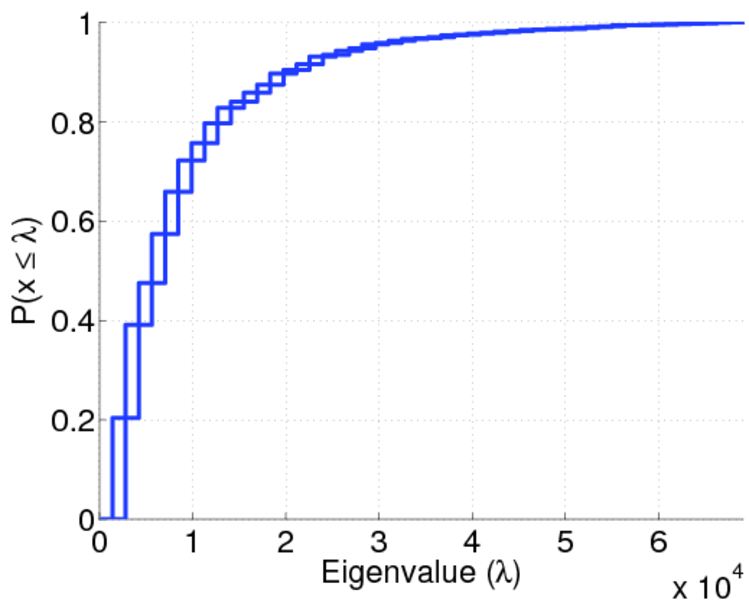
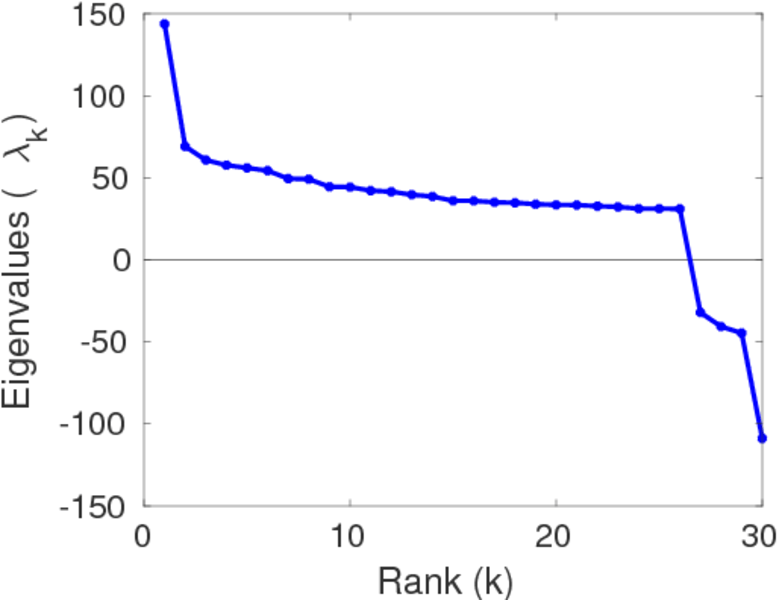
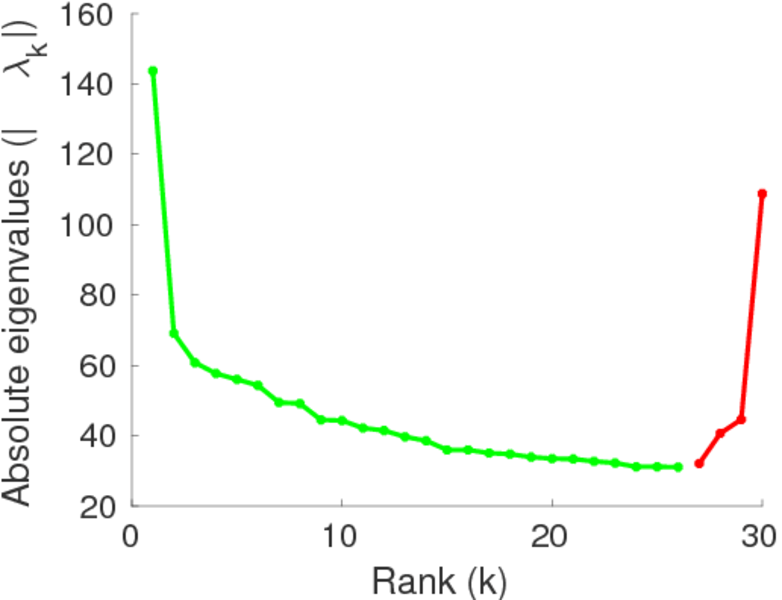
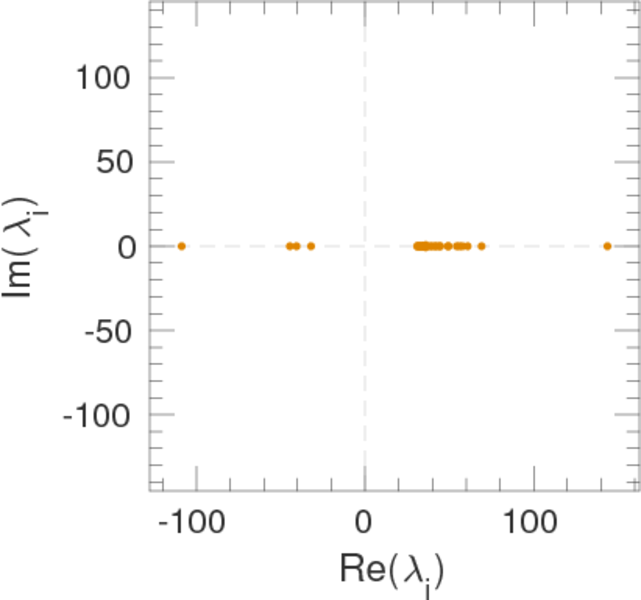
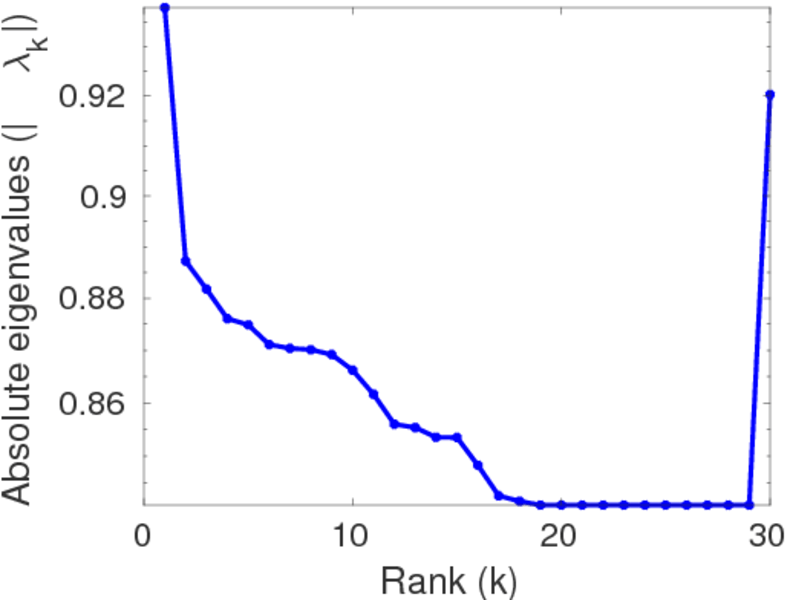
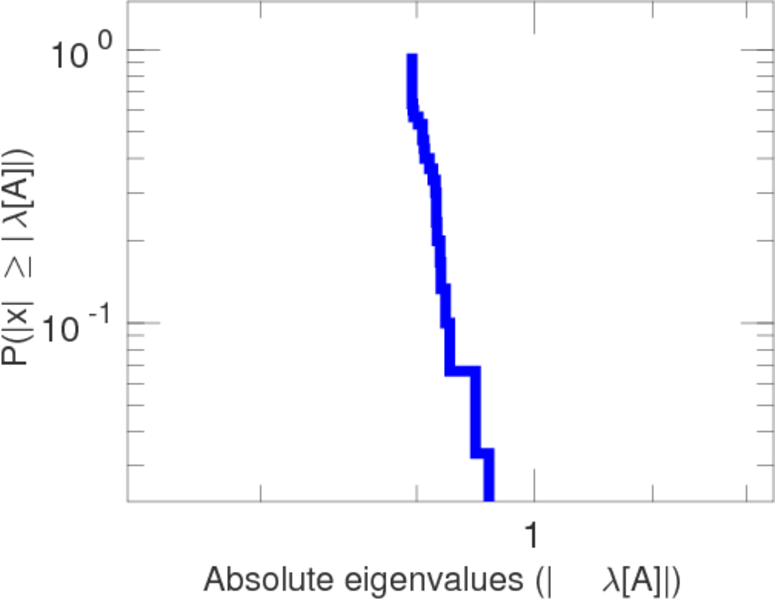
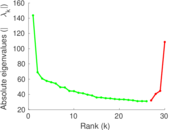
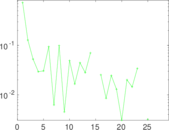
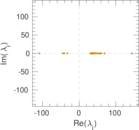
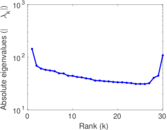
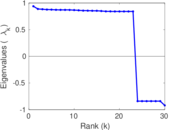
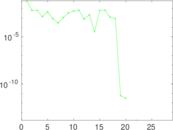
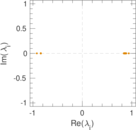
Matrix decompositions plots


Downloads
References
|
[1]
|
Jérôme Kunegis.
KONECT – The Koblenz Network Collection.
In Proc. Int. Conf. on World Wide Web Companion, pages
1343–1350, 2013.
[ http ]
|
|
[2]
|
Julia Preusse, Jérôme Kunegis, Matthias Thimm, Thomas Gottron, and Steffen
Staab.
Structural dynamics of knowledge networks.
In Proc. Int. Conf. on Weblogs and Soc. Media, 2013.
|
 KONECT ‣ Networks ‣
Buy Me a Coffee
KONECT ‣ Networks ‣
Buy Me a Coffee